Visual Leak Detector - Enhanced Memory Leak Detection for Visual C++
Visual C++로 프로그램을 짜다보면 마주치는 게 메모리 릭(Memory Leak)이다. 특히 라이브러리와 연동할 때, 자기가 짠 프로그램에 문제가 있는지 아니면 라이브러리에 문제 있는 건지 판단하기가 힘들 때, 메모리 할당/해제를 빼먹은 거 같은데, 어디에 있는지 모를 때는 Visual Leak Detector 라는 프로그램이 도와줄 것이다.
Visual C++ provides built-in memory leak detection, but its capabilities are minimal at best. This memory leak detector was created as a free alternative to the built-in memory leak detector provided with Visual C++. Here are some of Visual Leak Detector's features, none of which exist in the built-in detector:
* Provides a complete stack trace for each leaked block, including source file and line number information when available.
* Provides complete data dumps (in hex and ASCII) of leaked blocks.
* Customizable level of detail in the memory leak report.
Other after-market leak detectors for Visual C++ are already available. But most of the really popular ones, like Purify and BoundsChecker, are very expensive. A few free alternatives exist, but they're often too intrusive, restrictive, or unreliable. Here are some key advantages that Visual Leak Detector has over many other free alternatives:
* Visual Leak Detector is cleanly packaged as an easy-to-use library. You don't need to compile its source code to use it. And you only need to make minor additions to your own source code to integrate it with your program.
* In addition to providing stack traces with source files, line numbers, and function names, Visual Leak Detector also provides data dumps.
* It works with both C++ and C programs (compatible with both new/delete and malloc/free).
* The full source code to the library is included and it is well documented, so it is easy to customize it to suit your needs.
Visual Leak Detector is licensed free of charge as a service to the Windows developer community.
Visual Leak Detector를 자신이 사용하는 프로젝트에 적용하는 법은 매우 간단하다.
 vld-10.zip
Visual Leak Detector 1.0
위 vld-10.zip을 풀어보면 다음과 같은 파일 목록을 갖고 있을 것이다. 여기서 빨갛게 동그라미 친 부분인 3개 파일에 주목하자.
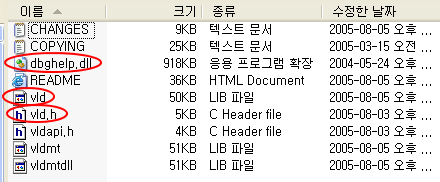
먼저, 프로젝트가 있는 곳을 $(PROJECT)라고 가정한다. vld.lib와 dbghelp.dll 등 두 개 파일을 $(PROJECT)/Debug 에 복사한다.
그 다음으로 vld.h를 $(PROJECT)에 복사한 후, Visual Studio에서 적절한 헤더 파일을 열어 #include "vld.h"를 추가한다. conv2군의 경우는 StdAfx.h에 추가하였다.

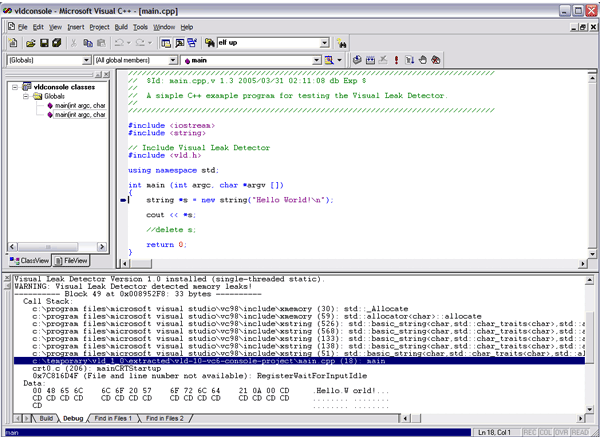
위와 같이 라이브러리 파일 복사하고 헤더 파일을 삽입하는 게 전부일 정도로 매우 쉽다는 것을 알았을 것이다. 그리고 이제 Rebuild 해서, 프로그램 메뉴를 선택하여 임의로 수행한 후 종료하면 디버그 창에 스택 위치와 관련한 메시지가 나타날 것이다. 물론 메모리 릭이 나는 프로그램이어야 하겠지만... 일단 메모리 릭에 걸려버리면 Visual Leak Detector가 감지해서 디버그 창으로 메세지를 보내준다.
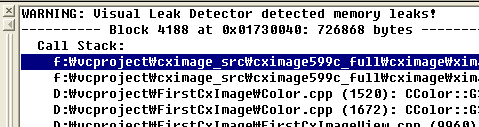
Call Stack 밑에 해당 소스 파일명이 나타나므로, 메모리 릭이 어디서 발생했는지 쉽게 알 수 있을 것이다. 또한 소스 파일명을 클릭하면 해당 소스로 위치 시켜주므로 매우 편리하다. 이제, 메모리 릭의 공포에서 벗어날 수 있게끔 도와주는 Visual Leak Detector를 멋지게 활용 하길 바란다. ^^;
---------------------------------------------
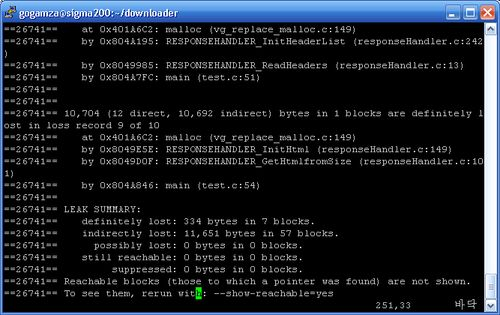
* 참고 : Visual Leak Detector가 Visual Studio 계열에서만 가능하다면, 리눅스에서는 Valgrind 가 있다. 실제로 Valgrind가 지원하는 플랫폼은 아래와 같다.
* x86/Linux: support is mature and almost complete.
* AMD64/Linux: support is new but fairly complete.
* PPC32/Linux: support is new, incomplete, but improving.
* AMD64/Linux: support is new but fairly complete.
* PPC32/Linux: support is new, incomplete, but improving.
덧글을 달아 주세요